


Empirical Research Synthesis
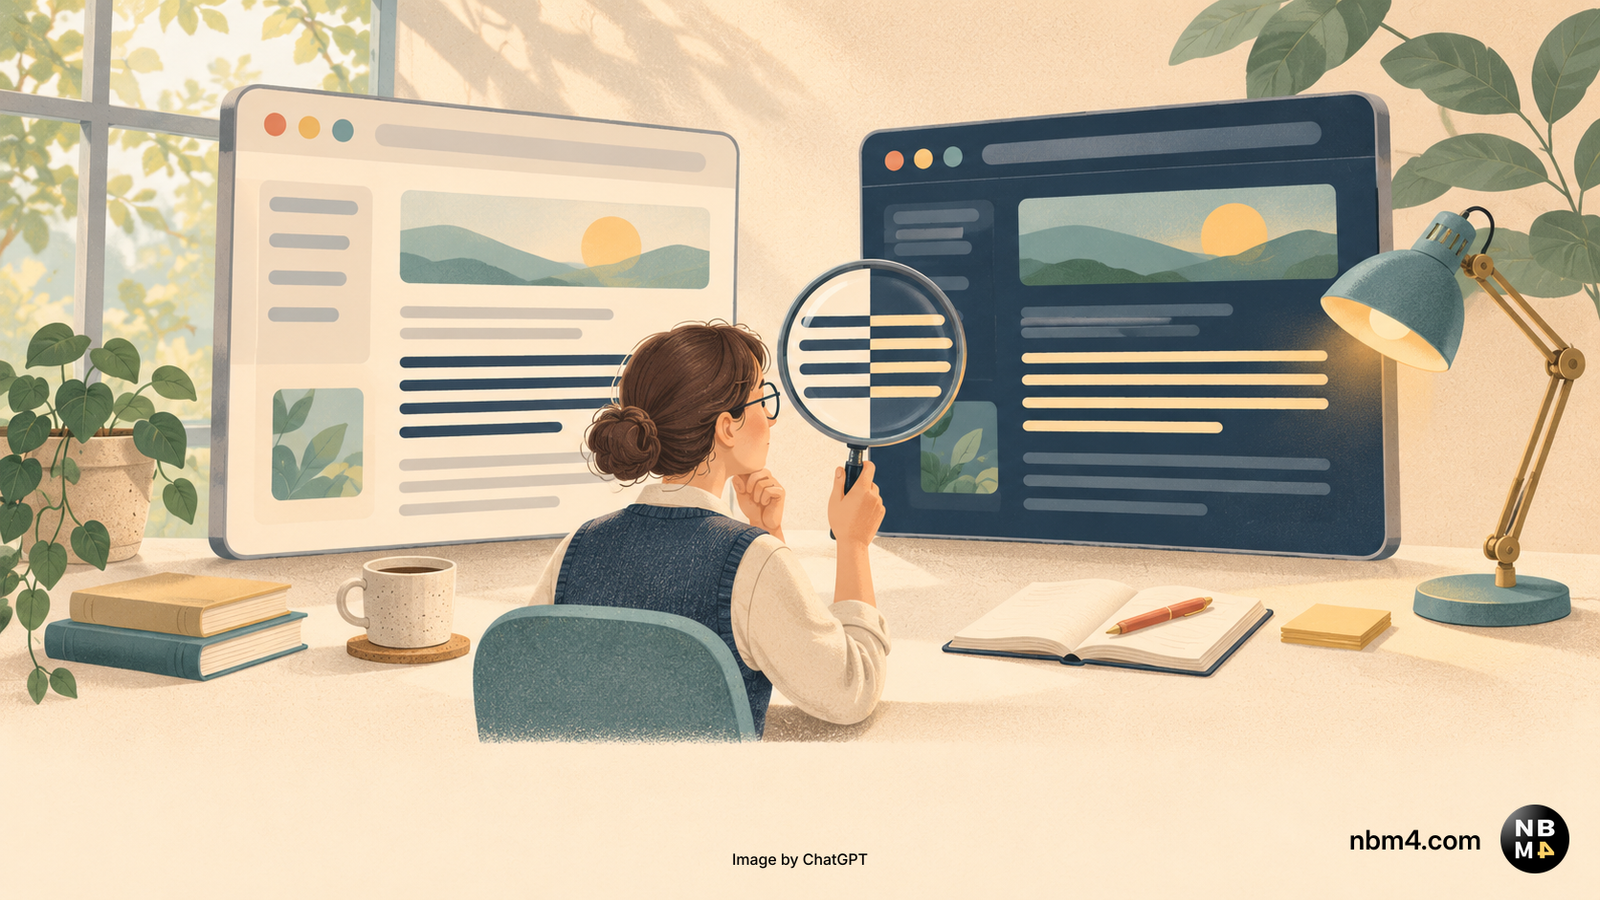
What peer-reviewed ergonomics, eye-tracking, neuroimaging, and consumer psychology actually prove about contrast polarity—and when Light, Dark, or Hybrid interfaces convert best.
Interactive Polarity Lab Active
This post defaults to warm off-white Light Mode per the empirical evidence below. Use the header toggle anytime to test Matte Dark Mode (`#121417`) against every chart and paragraph.
Key Audit Finding
40.9%
of CSS foreground-background pairings across the web’s top 500 domains fail WCAG 2.1 AA (4.5:1) contrast—a larger usability barrier than polarity itself.
No peer-reviewed scientific study establishes a universal conversion winner between light-mode (positive contrast polarity) and dark-mode (negative contrast polarity) websites. Randomized, multi-industry commercial A/B tests comparing light and dark themes on live conversion rates rarely appear in peer-reviewed journals; instead, empirical literature across visual psychophysics, human-computer interaction (HCI), NeuroIS, and consumer psychology evaluates the causal precursors of conversion—reading accuracy, cognitive performance, visual search speed, affective pleasure, perceived trustworthiness, and purchase intention. Synthesizing that evidence reveals a clear baseline asymmetry: light websites hold a statistically consistent ergonomic and trust advantage across high-information, comparison-heavy, and regulated conversion funnels, including mass-market e-commerce, checkout flows, general B2B SaaS marketing and pricing pages, finance, legal, healthcare, and government portals.
Dark websites convert competitively—or outperform on retention, perceived value, and task workload—only when negative polarity aligns with category norms, viewing environments, or symbolic brand positioning. Empirical studies support dark defaults or dark-first workspaces in four bounded contexts: luxury and prestige commerce (where low brightness signals dominance, exclusivity, and sophistication), data-dense analytics dashboards and developer environments (where dark themes lowered subjective workload at medium complexity and align with developer usage patterns), low-key or fine-art photography (where dark or neutral surrounds prevent shadow crushing), and low-ambient-light mobile, entertainment, or optical see-through augmented reality sessions (where reduced luminance curbs glare and improves display efficiency). Crucially, controlled experiments uncover a persistent preference–performance dissociation: users frequently prefer dark mode for aesthetics or perceived comfort while objectively scoring lower on cognitive, proofreading, and search tasks within it. Furthermore, basic contrast failures—affecting 40.9% of CSS-declared foreground-background pairings across the web’s top 500 domains—impose a larger usability barrier than theme polarity itself.
The Evidentiary Boundary: How Scientific Literature Measures Conversion
Assessing light versus dark web design rigorously requires separating empirical findings from practitioner folklore. While industry blogs frequently cite anecdotal conversion lifts, peer-reviewed research in ergonomics, information systems, and marketing isolates four measurable pathways that govern whether a visitor trusts a website, comprehends its offer, and completes a conversion action:
Optical & Perceptual Efficiency
Visual acuity, pupil aperture dynamics, proofreading accuracy, reading speed, and surround-induced contrast distortion.
Cognitive Load & Task Execution
Non-verbal reasoning scores, visual search latency, eye-tracking fixation efficiency, form-filling speed, and perceived workload (NASA-TLX).
Affective Valence, Trust & Brand Semiotics
Emotional responses (pleasure, arousal, dominance), processing fluency, perceived download speed, first-impression trustworthiness, and brand-personality congruence.
Physiological Context & Hardware
Ambient illumination matching, visual fatigue across prolonged sessions, ocular pathology (cataracts or macular degeneration), and display power consumption.
Where direct academic studies exist—such as laboratory buying-intention experiments, e-commerce task-efficiency trials, and mobile shopping eye-tracking—their quantitative outcomes are reported directly below. Where peer-reviewed conversion trials are absent (notably commercial photography bookings and live SaaS free-trial signups), conversion implications are explicitly marked as derived from verified psychophysical, ergonomic, and behavioral proxies.
Optical Physics, Cognitive Ergonomics, and the Preference–Performance Paradox
Across more than four decades of display ergonomics, positive contrast polarity (dark text on a light background) has consistently outperformed negative contrast polarity (light text on a dark background) on text-intensive and detail-critical tasks. Secondary ergonomics commentary frequently cites an early CRT visual display study by Bauer and Cavonius (1980) reporting 26% higher reading accuracy with dark characters on a light background. Modern controlled experiments on contemporary displays confirm both the persistence and the physical mechanism of this effect. Buchner, Mayr, and Brandt (2009) independently manipulated display polarity and screen luminance, demonstrating that the “positive polarity advantage” is driven primarily by higher screen brightness rather than polarity convention alone, holding across both bright office lighting (550 lux) and dark rooms (5 lux).
Piepenbrock, Mayr, and Buchner (2014) verified the ocular mechanism via eye tracking in Ergonomics: brighter positive-polarity displays significantly constricted participants’ pupils (t(34) = −17.49, p < .01, dz = 2.96), producing a pinhole optical effect that deepens focus, sharpens the retinal image, and minimizes optical aberrations. Both proofreading accuracy (b = −0.24, t = −6.04, p < .01) and reading rate (b = −2.12, t = −5.12, p < .01) rose significantly as pupil diameter decreased, translating into medium-to-large performance gains for light mode in accuracy (t(34) = 4.54, p < .01, dz = 0.77) and reading speed (t(34) = 4.04, p < .01, dz = 0.68). Conversely, viewing a dark screen dilates the pupil, admitting light through less regular peripheral regions of the cornea and lens and inducing optical blurring—a mechanism noted across ergonomics literature (Dobres et al., 2016) and reflected in participants reporting greater perceived screen blur and line-skipping difficulty in dark mode. Optometry and accessibility commentary further emphasizes that this blur manifests as “halation” (bright strokes glowing into dark backgrounds) among the roughly 30%–50% of adults estimated by practitioner sources to have some degree of astigmatism, particularly when uncorrected or under-corrected.
The Positive Polarity Advantage (Piepenbrock et al., 2013–2014)
Constricted Pupil (Pinhole Effect)
Higher screen luminance shrinks pupil diameter (dz = 2.96), sharpening retinal focus and minimizing spherical aberration & halation.
Measured Positive-Polarity Advantage (Cohen’s d / dz, all p < .01)
Three peer-reviewed ergonomic boundary conditions directly govern reading and decision friction on commercial websites. First, small typography linearly amplifies the light-mode advantage. In an experiment of 160 participants testing 8, 10, 12, and 14 pt text in Human Factors, Piepenbrock, Mayr, and Buchner (2014) found a main proofreading advantage for positive polarity (F(1, 158) = 9.34, p = .003, η² = .056) alongside a significant linear interaction with character size (F(1, 158) = 8.92, p < .01, η² = .05), demonstrating that dark mode’s legibility penalty widens steadily as font size shrinks. On mobile viewports, pricing footnotes, shipping disclosures, and dense SaaS comparison matrices, small white-on-dark typography compounds reading friction. Second, aging amplifies glance-legibility losses in dark mode. Both Piepenbrock, Mayr, Mund, and Buchner (2013)—who confirmed positive polarity gains for younger adults (d = 2.17) and older adults (d = 0.58)—and MIT AgeLab psychophysical studies by Dobres et al. (2016, 2017) showed that negative polarity requires longer presentation thresholds to read words accurately under brief glances, with age-related legibility degradation steepest for geometric square-grotesque typefaces set in negative polarity.
Third, general cognitive performance favors light mode, whereas specific ocular pathologies split in opposite directions. In an international Ergonomics study (N = 173 total; N = 172 in demographic interaction models), Gazit et al. (2025/2026) evaluated non-verbal logical reasoning, pattern recognition, and abstract thinking (modeled on Raven Progressive Matrices and Bongard Problems) and found significantly higher cognitive scores in light mode (M = 4.92, SD = 1.79) than dark mode (M = 4.55, SD = 1.72; F(1, 172) = 9.61, p = .002, ηp² = .05), with light mode scoring higher across every age and gender subgroup—peaking among young males aged 18–25 in light mode (M = 5.53) and bottoming out among females aged 26–65 in dark mode (M = 4.00). (Participants with academic education outperformed non-academic peers specifically in dark mode.) Conversely, a controlled 30-minute reading trial in low-vision patients (N = 40) identified a strong pathology-by-polarity interaction (p < 0.01): participants with cloudy ocular media such as cataracts (n = 18) read 17.0% faster in dark mode (84.7 vs. 72.4 words/min, p < 0.01) due to lower intraocular glare scatter, whereas participants with central field loss such as macular degeneration (n = 22) read 10.5% slower in dark mode (54.8 vs. 61.2 words/min, p = 0.04). Across the combined low-vision cohort, overall reading speed (p = 0.42) and error rates (4.2 vs. 3.8 errors per 200 words, p = 0.35) did not differ significantly, though dark mode improved subjective visual comfort (72.1 vs. 58.4, p < 0.01).
Non-Verbal Cognitive Scores by Polarity (Gazit et al., 2025/2026)
Light mode significantly outperformed dark mode overall (M = 4.92 vs. 4.55, p = .002). Crucially, matching users’ stated theme preference yielded no performance benefit (F(2, 160) = 1.01, p = .366).
Crucially, stated user preference does not predict objective performance. When Gazit et al. (2025/2026) tested whether participants performed better in their preferred theme, the interaction was statistically null (F(2, 160) = 1.01, p = .366, ηp² = .01): dark-mode enthusiasts still scored higher on cognitive tasks in light mode. Similarly, Piepenbrock et al. (2014) observed that participants perceived no difference in their ability to focus on text across polarities despite committing significantly more proofreading errors in dark mode. Sethi and Ziat (2023) clarified this disconnect in Ergonomics using eye tracking and subjective workload ratings across younger (<33 years) and older (>45 years) adults in bright (350–355 lux) and dim (15 lux) rooms: dark mode induced higher objective cognitive load (longer search times and larger pupil diameter) for older adults in bright rooms and younger adults in dim rooms. Older adults selected light mode to avoid mental fatigue (and reported higher mental effort and less positive emotion in dark mode), whereas younger adults favored dark mode in dim rooms primarily for its aesthetic feel despite incurring higher search load.
Claims that dark mode universally prevents digital eye strain are likewise unsupported under normal daytime conditions. In a 2025 crossover study of female tablet users reading continuously for one hour under standard lighting (IJERPH), Sengsoon and Intaruk found that subjective visual fatigue rose significantly in both light mode (11.47 to 18.37, p < 0.001) and dark mode (12.40 to 18.87, p < 0.001), with no statistically significant difference between modes (p = 0.305)—although the authors observed a significant between-mode difference in critical flicker frequency (CFF) and concluded that dark mode may modestly mitigate eye-fatigue risk over extended sessions. Controlled lighting trials confirm that ambient illumination matching drives visual comfort: dark mode measurably lowers eye fatigue in genuinely dark spaces (nighttime or <3 lux rooms, as in Xie et al., 2021), whereas daytime productivity trials (Pedersen et al., 2020) found zero difference in speed or errors, and bright ambient light washes out dark interfaces through screen reflections.
Affective Psychology, Processing Fluency, and Trust Formation
Conversion depends as heavily on rapid affective judgment and perceived credibility as on reading speed. Peer-reviewed environmental psychology and NeuroIS research show that screen brightness (value) systematically shifts emotional states, perceived wait times, and trustworthiness cues.
In a foundational study in the Journal of Experimental Psychology: General, Valdez and Mehrabian (1994) quantified how brightness (B) and saturation (S) drive Pleasure, Arousal, and Dominance, obtaining standardized regression equations that held almost identically for both chromatic and achromatic (black, white, and gray) stimuli:
Pleasure
0.69B + 0.22S
Arousal
−0.31B + 0.60S
Dominance
−0.76B + 0.32S
These coefficients illuminate the commercial divergence between light and dark web design. Higher brightness strongly elevates Pleasure (+0.69), fostering openness and positive affect, whereas lower brightness (darkness) exerts an even stronger pull on Dominance (−0.76) and moderately raises Arousal (−0.31), projecting authority, power, and exclusivity. (Subsequent domain-specific work, such as comic-panel corpus analysis, cautions that isolated brightness-arousal predictions attenuate when complex narrative content dominates the frame.) Extending value effects directly to web interactions in the Journal of Marketing Research, Gorn, Chattopadhyay, Sengupta, and Tripathi (2004) showed that higher-value (lighter) and lower-chroma download screens elicited greater relaxation, which mediated faster perceived download speed, higher site evaluations, and greater likelihood of recommending the website.
Processing Fluency Theory (Reber, Schwarz, & Winkielman, 2004) connects visual legibility to commercial persuasion: stimuli processed with minimal cognitive friction—through crisp figure-ground contrast, symmetry, and prototypical layout—generate a positively valenced “hedonic mark” that users unconsciously attribute to the quality and attractiveness of the stimulus. (By contrast, later replication syntheses note that the contrarian offshoot claiming visual “disfluency” improves analytical reasoning failed across 18 independent studies.) In a web-specific experiment in Behaviour & Information Technology, Hall and Hanna (2004) demonstrated that higher text-background contrast ratios drove readability, while preferred color combinations raised aesthetic ratings and intention to purchase.
Where trust is the decisive conversion barrier, dark themes face documented headwinds in mainstream categories. In a controlled experiment of over 200 participants evaluating 24 finance, legal, and medical websites in Technical Communication, Alberts and van der Geest (2011) varied only the color scheme (red, blue, green, black) on otherwise identical pages: color exerted a statistically significant (though modest relative to site reputation) effect on first-impression trustworthiness, with blue rated most trustworthy and black least trustworthy, moderated by color-context congruence. Cross-cultural multi-method research by Cyr, Head, and Larios (2010) in the International Journal of Human-Computer Studies confirmed website color appeal as a significant predictor of e-trust, satisfaction, and e-loyalty. In NeuroIS research, a pilot repeated-measures MANOVA by Nissen and Riedl (2021) demonstrated that design mode (light vs. dark) significantly affects users’ pleasure, arousal, trust, attitude, and use intention (whereas button shape had no significant effect), and follow-up fNIRS neuroimaging (Nissen, Riedl, & Schütte, 2024) confirmed that purposeful color—especially blue—produces prefrontal cognitive relief (right dlPFC deactivation) and lowers distrust relative to uncolored or red-dominated pages.
Interactive PAD Emotional Simulator & Audience Mode Preferences
Valdez & Mehrabian (1994) PAD Model
Signal: High Pleasure, Low Dominance — feels open, trustworthy, and approachable (ideal for B2B, healthcare, and general retail).
Stated Mode Preference by Context & Gender
Dark-mode demand drops sharply on utilitarian web shopping and among women (p = .003).
Audience demographics and usage contexts create equally sharp preference splits that marketers routinely overlook when citing headline mobile adoption surveys. Although mixed-method smartphone surveys find 68.4% dark-mode preference among general mobile app users and 79.7% among university students on phones, explicit dark-mode preference plunges to 29.0% in utilitarian web e-commerce tasks. Gender further moderates preference: in Gazit et al. (2025/2026), gender correlated significantly with mode preference (χ² = 11.48, C = .27, p = .003), with 52.7% of women preferring light mode (31.9% dark, 15.4% both), whereas men were more evenly distributed and far more likely to feel comfortable with either mode (33.8% light, 28.0% dark, 38.0% both). Consumer sites serving predominantly female or older (>45) audiences therefore face compounded friction from dark-only defaults.
Category-by-Category Empirical Synthesis
Because color associations and ergonomic bottlenecks vary substantially across tasks and industries (Alberts & van der Geest, 2011; Labrecque & Milne, 2012), optimal polarity must be evaluated at the website-category level.
E-Commerce and M-Commerce: Mass-Market Retail vs. Luxury Goods
Empirical literature divides e-commerce into two contrasting strategic regimes: mass-market comparison shopping, where light mode consistently supports speed, clarity, and trust, and luxury/prestige retail, where dark or desaturated minimalist designs amplify symbolic status.
In mass-market e-commerce, controlled usability and buying-intention studies favor light mode. In a cross-device experiment of 62 participants performing non-leisure online shopping tasks, Vinciūnas and Kapočius (2023) found that light mode accelerated product opening by 2.25 seconds (8.2% faster) and form filling by 4.59 seconds (4.0% faster)—which the authors characterized as modest (“weak”) support for light-mode efficiency—while only 29% of shoppers expressed a preference for dark mode. Laboratory experiments and qualitative buyer interviews by Pelet and Papadopoulou (2011, 2012) in the European Journal of Information Systems and the International Journal of E-Business Research demonstrated that sufficient contrast and legible color-brightness pairings supported product memorization (marginal free-recall interaction, F = 2.484, p ≤ 0.061) and buying intention, whereas negative mood depressed buying intention; interviewed shoppers explicitly noted that bright, convivial layouts encouraged store exploration while dark, harder-to-read designs discouraged revisiting. Subsequent academic e-commerce usability reviews also cite prior findings (Nazeriha & Jonsson, 2020) warning of a potential decrease in brand trust when standard retail stores adopt dark mode.
Mobile commerce—which industry estimates cited in 2026 academic proceedings place at roughly 80% of retail visits and 60% of global orders—introduces notable gender and physiological trade-offs. In an m-commerce study of layout and polarity, Chen and Zha (2023) reported that women performed better and searched faster in light mode whereas men performed better in dark mode. Extending this work with a Tobii Pro Nano eye tracker under 565 lux office lighting on mobile-aspect Amazon and Temu layouts, Diaz-Alvarez et al. (2026, WEBIST) found that dark mode produced consistently larger pupil diameters across all 30 measured Areas of Interest (30 vs. 0) and provoked greater visual fatigue, whereas light mode registered higher fixation counts (10 vs. 4), greater total fixation duration (2 vs. 0), and higher perceived mental discomfort, with equal physical discomfort across modes. Women again displayed significantly larger pupil diameters than men in both polarities and preferred light mode at higher rates. Two methodological caveats apply to Diaz-Alvarez et al. (2026): participants were software engineering students and professors (explaining their overall preference for dark mode), and dark stimuli were generated via Firefox’s automatic color inversion rather than bespoke dark design systems. Finally, a 2025 Journal of Consumer Marketing study combining a live Facebook click-through field test with lab mediation experiments demonstrated that high foreground-to-foreground visual contrast reduces perceived display crowding, elevates aesthetics, and raises shopping intentions regardless of background polarity—reinforcing why standard white-cutout retail product photography often breaks visually when dropped carelessly onto dark backgrounds.
Luxury and prestige e-commerce operates under a different psychological contract. Rather than optimizing solely for rapid comparison, luxury buyers seek status, rarity, and symbolic distance. Across four marketing experiments in the Journal of the Academy of Marketing Science, Labrecque and Milne (2012) confirmed that black conveys sophistication, glamour, power, and dignity, whereas white conveys sincerity. Three experiments in the Journal of Consumer Behaviour (2022) demonstrated that achromatic black-and-white visual designs significantly raise perceived luxuriousness, exclusivity, and brand authenticity via psychological distance—improving ad evaluations most strongly for hedonic (versus utilitarian) appeals. Complementing this, Lee and Fujita (2021) in the Journal of Consumer Psychology showed that black-and-white visuals prompt abstract, high-level construal (“why”—core prestige and social significance), whereas chromatic visuals elicit concrete construal (“how”—immediate sensory impulse).
Crucially, however, peer-reviewed luxury science shows that darkness is not the sole aesthetic route to luxury conversion. Across seven studies in the Journal of Consumer Research, Yoon and Zhu (2025/2026) proved that low color saturation elevates perceived luxury brand status via perceived continuity heritage—specifically when a brand emphasizes an older foundation year, while reversing when the brand highlights innovativeness as its core positioning. Likewise, Kim et al. (2020) found that low saturation combined with a high-brightness background boosted luxury ad attitudes and purchase intentions, and packaging/advertising studies (Pracejus et al., 2006; Wu, 2023) confirm that generous white space enhances perceived prestige, quality, and willingness to buy among higher-income consumers. Luxury retailers can therefore convert strongly with either matte dark charcoal (particularly for dramatic jewelry, watches, automotive, and heritage fashion) or airy, desaturated, high-whitespace light themes—while retaining crisp, low-friction contrast inside checkout forms.
SaaS, Data Dashboards, and Developer Tools
No peer-reviewed A/B study directly compares live SaaS trial-signup conversion rates across light and dark landing pages. However, HCI and eye-tracking evidence clearly separates acquisition surfaces (marketing pages, pricing tiers, documentation, signup forms) from application workspaces (analytics dashboards and IDEs that govern product-led conversion and retention).
On SaaS marketing pages, pricing matrices, and onboarding forms, visitors scan dense feature comparisons, evaluate small-print billing terms, and complete multi-field inputs. Piepenbrock et al.’s (2014) small-font positive-polarity advantage, Vinciūnas and Kapočius’s (2023) 4.0% form-filling speed advantage, Gazit et al.’s (2025/2026) cognitive comprehension edge, and Alberts and van der Geest’s (2011) trustworthiness findings converge on light mode as the lowest-friction default for general B2B, enterprise, HR, and healthcare SaaS. The primary exception is developer-focused, cybersecurity, and AI-infrastructure SaaS: consistent with belief- and color-context congruence theory (Alberts & van der Geest, 2011; Sasidharan, 2010), a disciplined matte-dark marketing site signals technical authenticity to engineering buyers—provided pricing tables and forms maintain generous font sizes and accessible contrast.
Inside analytics dashboards and business intelligence (BI) workspaces, the empirical picture shifts meaningfully toward dark mode. In a within-subjects eye-tracking experiment presented at ACM ETRA ’25, Ettling, Bektaş, Steinmann, and Abbad-Andaloussi (2025) evaluated light and dark dashboards across easy, medium, and hard decision-making tasks. Dark mode improved task accuracy, user confidence, and fixation efficiency at medium complexity levels and produced lower perceived cognitive workload (NASA-TLX) than light mode despite inducing wider relative pupil dilation. Whereas light-mode task completion time rose with task difficulty, dark mode exhibited no clear slowdown trend. Corroborating this shift from text to graphical perception, a 2024 crowdsourced visualization study testing bar charts, line charts, and scatterplots across younger and older adults found no meaningful performance-time penalty for dark mode across age groups. For interactive geographic maps, Qiao and Wu (2023) found that ambient-matched interfaces performed best (light-during-day first, dark-at-night second, both outperforming light-at-night), though users still expressed lower practical preference for dark maps.
For software development environments (IDEs), controlled performance appears neutral while long-session ergonomics and user demand heavily favor dark themes. An eye-tracking thesis at KTH (N = 30–35 computer science students) comparing editor-realistic light and dark code themes found no statistically significant difference in completion time (33.27 s light vs. 31.70 s dark), accuracy (82.28% light vs. 83.47% dark), or gaze patterns. Observational developer research, however, records overwhelming behavioral preference—only 25.59% chose light mode and 5.27% were neutral, leaving roughly 69% favoring dark mode—alongside lower self-reported eye strain and steadier error rates over prolonged coding sessions (though self-selection and higher developer experience correlated with dark-mode use, precluding strict causal attribution). For technical SaaS, supporting a polished dark workspace is effectively table stakes for activation and retention.
Photography, Visual Art, and Portfolio Websites
No peer-reviewed empirical study directly tests client inquiry or print-purchase conversion rates on light versus dark photography websites. Nevertheless, color-appearance psychophysics and empirical aesthetics establish precisely how page background luminance alters perceived photographic quality—the core driver of portfolio conversion.
The foundational principle is the Bartleson-Breneman Effect (1967) from Eastman Kodak Research Laboratories. Perceived image contrast is not fixed by the image file; it shifts as a power function of surround luminance, with the brightness-versus-luminance exponent falling from 0.50 in a light surround to 0.41 in a dim surround and 0.33 in a dark surround (a 1.5 : 1.25 : 1.0 ratio). As formalized in color-appearance modeling and color-managed photography standards, framing an image on a dark background induces three simultaneous perceptual distortions: perceived midtone contrast appears flatter (Bartleson-Breneman effect), perceived color richness drops (Hunt effect), and perceived overall exposure appears exaggerated. Because controlled empirical aesthetics research in Psychonomic Bulletin & Review demonstrates that color presence amplifies pleasure ratings of positive real-life photographs by up to one standard deviation—and moderately higher saturation consistently increases aesthetic pleasure (Tinio & Leder, 2009; Wilms & Oberfeld, 2018)—perceptual desaturation can subtly blunt emotional appeal on bright color portfolios.
Bartleson-Breneman Surround Contrast Lab
Light Surround (Exponent 0.50): Notice how the warm daylight colors appear punchier and richer, while the darkest shadow steps on the right begin to merge toward flat black (100:1 simultaneous luminance limit).
Conversely, bright white backgrounds carry a severe shadow-rendering liability. Because the human visual system simultaneously resolves only an approximate 100:1 luminance range, any image region darker than roughly 1% of a bright white surround’s luminance collapses visually into flat black. These opposing psychophysical constraints dictate key-matched curation rather than a single polarity rule. High-key, wedding, food, lifestyle, and bright architectural portfolios—motifs where empirical preference studies (Barzut et al.) show color vibrancy drives beauty judgments and clients expect warmth and approachability—benefit from the higher perceived contrast (0.50 exponent), richer perceived saturation, and elevated baseline pleasure (+0.69B) of soft off-white or light neutral gray canvases. By contrast, low-key, chiaroscuro, nightlife, astrophotography, cinematic commercial, and dramatic black-and-white fine-art portfolios risk shadow clipping against bright white; presenting them against matte dark charcoal or calibrated neutral mid-gray (18% gray) preserves delicate shadow gradations while reinforcing dominance (−0.76B), exclusivity, and contemplative depth.
High-Trust Institutional Verticals: Finance, Legal, Healthcare, and Government
In regulated, high-stakes domains where institutional credibility drives conversion—opening financial accounts, retaining legal counsel, scheduling medical care, or submitting public-sector applications—empirical evidence favors light mode paired with restrained cool (especially blue) palettes. Alberts and van der Geest’s (2011) controlled evaluation of 24 finance, legal, and medical sites established that black-dominated schemes scored lowest in perceived trustworthiness while blue scored highest. Environmental health color research similarly recommends bright, soft, soothing tones while discouraging heavy dark palettes in clinical and wellness contexts to minimize user anxiety. Given that healthcare, wealth management, and government portals serve large shares of adults over 45—who experience elevated cognitive load and steeper legibility decline in negative polarity (Dobres et al., 2016; Sethi & Ziat, 2023; Gazit et al., 2025/2026)—light mode is the empirically sound acquisition default, with dark mode reserved strictly as an opt-in preference inside mobile banking or utility apps.
E-Learning, Media, Entertainment, and Spatial XR Interfaces
E-Learning and EdTech platforms straddle an instructive divide between short-term assessment accuracy and sustained study retention. While objective cognitive reasoning favors light mode (Gazit et al., 2025/2026), a 2024 university preprint (N = 650 surveyed; N = 120 MOOC usability participants) found that 79.7% of students preferred dark mode on smartphones, 61.7% wanted dark mode on learning platforms, 79% strongly agreed dark mode reduced eye strain during study, and 72% indicated they would spend longer sessions on the platform in dark mode. Adding a biological dimension, ophthalmology research in Scientific Reports by Aleman, Wang, and Schaeffel (2018) demonstrated via optical coherence tomography (OCT) in young adults that reading black-on-white text stimulates retinal OFF pathways and causes choroidal thinning (associated with myopia progression), whereas white-on-black text activates ON pathways and induces choroidal thickening (protective against myopia)—though the authors stressed that longitudinal epidemiological trials in children are needed, and subsequent electroretinography work indicates effects vary by refractive error and age of onset. EdTech sites therefore optimize both enrollment conversion and study retention by keeping marketing pages and timed assessments in light mode while offering a prominent dark-mode toggle inside long-form study interfaces.
Media, streaming, gaming, and nighttime mobile apps align naturally with dark defaults because viewing occurs heavily in dim ambient rooms where dark interfaces minimize glare and visual fatigue (Xie et al., 2021) and can extend browsing time when paired with low-arousal accents. On OLED smartphones, Purdue University’s hardware power profiler (Dash & Hu, 2021, ACM MobiSys) measured 39%–47% display power savings at 100% screen brightness and 11%–38% at 50% brightness—with light mode at 20% brightness drawing roughly the same power as dark mode at 50% brightness in Google News. However, LCD laptops and budget phones gain zero battery savings from dark mode, and 2025 sustainability research cautions that users who raise screen brightness to compensate for dark-mode readability can offset much of the theoretical energy gain.
Finally, spatial XR web interfaces split cleanly by display optics. In enclosed virtual reality (VR) and video see-through mixed reality (MR) headsets, Luzsa and Mayr (2024, Ergonomics) confirmed that positive polarity remains superior for reading and fast reaction tasks, and users prefer positive polarity for text in MR. Conversely, on additive optical see-through augmented reality headsets (such as Microsoft HoloLens, which project light over the real world and cannot block ambient light to render black), Erickson et al. (2021, ACM Transactions on Applied Perception) demonstrated that dark-mode graphics deliver significantly better visual acuity, reduced fatigue, and superior usability, with user preference tracking physical room lighting.
Recommended Default Polarity by Website Category
Implementation Architecture: Why Contrast Engineering Outweighs Polarity Dogma
Selecting the empirically optimal default polarity fails to lift conversions if contrast execution is flawed. A 2026 static accessibility audit of the Common Crawl’s top 500 domains (428 analyzable homepages; 240 containing parseable CSS color declarations; 4,327 unique foreground-background pairings) found that 40.9% (1,771 pairings) failed the WCAG 2.1 Level AA minimum contrast ratio of 4.5:1 for normal text. The median per-site pass rate was 62.7% (mean 59.8%), and only 20.4% (49 domains) achieved full compliance across all declared pairings—even before accounting for external stylesheets or JavaScript-injected styles. Because luminance contrast ratio is the primary determinant of visual search speed and reading accuracy across both polarities, eliminating contrast failures delivers larger usability gains than switching themes alone.
Common Crawl Top 500 Audit (2026)
WCAG 2.1 AA Contrast Failures (4,327 CSS Pairings)
Purdue OLED Power Profiler (Dash & Hu, 2021)
Dark Mode Display Power Savings by Brightness
Implementing dark mode competently is also more demanding than color inversion because human suprathreshold contrast perception behaves asymmetrically across dark and light backgrounds—a gap motivating the developing APCA Readability Criterion (derived from the SAPC model). The table below synthesizes peer-reviewed ergonomic constraints alongside widely adopted accessibility and UX implementation standards (distinguished explicitly by evidence basis):
| Design Parameter | Recommended Specification | Scientific Rationale vs. Applied Design Standard |
|---|---|---|
| Dark Surface & Text Contrast | Meet WCAG 2.1 AA (≥4.5:1 normal text, ≥3:1 large text) using matte dark grays (#121212–#1E1E1E) and off-white text (#E0E0E0–#F0F0F0) rather than pure #FFFFFF on #000000. | Empirical + Applied: Pupil dilation increases optical blur in dark mode; editor-realistic non-pure gray themes are used in academic IDE trials to avoid harsh-contrast strain, and accessibility guidelines recommend dimmed dark surfaces to limit glare and halation. |
| Light Surface & Chromatic Backgrounds | Use achromatic white or warm off-white surfaces for body text; avoid dark text on saturated short-wavelength blue backgrounds. | Empirical: Peer-reviewed readability studies confirm achromatic light backgrounds minimize reading time and maximize preference, whereas black text on saturated short-wavelength blue is significantly harder to resolve. |
| Typography Scaling in Dark Mode | Maintain larger body text sizes (avoiding ≤10–12 pt equivalents), avoid square-grotesque fonts at small sizes, and avoid ultra-thin stroke weights. | Empirical: Piepenbrock et al. (2014) established that dark mode’s proofreading penalty grows linearly as font size shrinks, and Dobres et al. (2016) found steepest age-related glance-legibility loss for square-grotesque type in negative polarity. |
| Chromatic Accents & Media Assets | Moderate accent saturation on dark surfaces; audit transparent logos, product cutouts, focus states, and form borders independently in both themes. | Empirical + Applied: Gorn et al. (2004) noted that high-chroma screen colors intensify cone fatigue and reduce relaxation; applied e-commerce UX guidance emphasizes preventing white-box cutouts and broken form states from eroding checkout trust. |
| User Control & Checkout Safeguards | Honor OS prefers-color-scheme on first paint only if both modes are fully QA-tested; provide a persistent manual toggle and preserve high-clarity checkout containers. | Empirical + Applied: Divergent ocular needs (cataracts reading 17.0% faster in dark mode vs. macular degeneration reading 10.5% faster in light mode) and demographic splits make user choice valuable, while UX practice stresses that one rigorously accessible light theme beats an incomplete dark theme. |
The Empirical Default Rule
If an organization can maintain only one fully engineered theme, light mode is the empirically stronger conversion default for mass-market e-commerce, general B2B SaaS marketing, finance, legal, healthcare, government, and high-key commercial photography—supported by consistent advantages in pupil optics, small-text legibility, cognitive test accuracy, e-commerce task speed, baseline affective pleasure, and first-impression trust.
Dark mode becomes the strategically superior default when symbolic brand dominance (luxury and prestige retail), shadow preservation (low-key and fine-art photography), medium-complexity analytical workspaces (BI dashboards and developer tools), or nighttime and optical see-through AR viewing define the core user task. For high-engagement web applications and e-learning platforms, the highest-performing architecture avoids rigid polarity dogma altogether: anchoring trust-critical landing pages, pricing tables, and checkouts in high-fluency light design while providing a contrast-calibrated, persistent theme toggle that adapts to user demographics, ambient light, and clinical visual needs.
Key Peer-Reviewed Studies Referenced in This Synthesis
• Alberts, W. A., & van der Geest, T. M. (2011). Color matters: Color as trustworthiness cue in web sites. Technical Communication.
• Aleman, A. C., Wang, M., & Schaeffel, F. (2018). Reading and myopia: Contrast polarity matters. Scientific Reports.
• Bartleson, C. J., & Breneman, E. J. (1967). Brightness perception in complex fields. Journal of the Optical Society of America.
• Buchner, A., Mayr, S., & Brandt, M. (2009). The advantage of positive text-background polarity is due to high display luminance. Ergonomics.
• Dash, P., & Hu, Y. C. (2021). How much battery does dark mode save? An accurate OLED display power profiler. ACM MobiSys.
• Diaz-Alvarez et al. (2026). Eye-tracking evaluation of m-commerce light vs. dark mode under office lighting. WEBIST.
• Dobres, J., Chahine, N., & Reimer, B. (2016/2017). Effects of polarity, typeface, and age on glance legibility. MIT AgeLab / Ergonomics.
• Erickson, A., Kim, K., Bruder, G., & Welch, G. F. (2021). Effects of dark mode graphics on visual acuity and fatigue in optical see-through AR. ACM Transactions on Applied Perception.
• Ettling, Bektaş, Steinmann, & Abbad-Andaloussi (2025). Light vs. dark BI dashboards across task complexity. ACM ETRA ’25.
• Gazit, T., et al. (2025/2026). Display polarity, demographic preferences, and non-verbal cognitive performance. Ergonomics.
• Gorn, G. J., Chattopadhyay, A., Sengupta, J., & Tripathi, S. (2004). Waiting for the web: How screen color affects time perception. Journal of Marketing Research.
• Hall, R. H., & Hanna, P. (2004). The impact of web page text-background colour combinations on readability, retention, aesthetics and behavioural intention. Behaviour & Information Technology.
• Labrecque, L. I., & Milne, G. R. (2012). Exciting red and competent blue: The importance of color in marketing. Journal of the Academy of Marketing Science.
• Luzsa, R., & Mayr, S. (2024). Positive polarity advantage in VR and video see-through MR. Ergonomics.
• Nissen, A., & Riedl, R. (2021) / Nissen, Riedl, & Schütte (2024). NeuroIS fNIRS investigations of dark/light mode and color trust cues.
• Pelet, J. É., & Papadopoulou, P. (2011/2012). The effect of colors of e-commerce websites on consumer mood, memorization and buying intention. EJIS / IJEBR.
• Piepenbrock, C., Mayr, S., & Buchner, A. (2013/2014). Positive display polarity is advantageous for both younger and older adults & smaller font sizes. Ergonomics / Human Factors.
• Reber, R., Schwarz, N., & Winkielman, P. (2004). Processing fluency and aesthetic pleasure. Personality and Social Psychology Review.
• Sethi, T., & Ziat, M. (2023). Dark mode cognitive load across age groups and ambient lighting. Ergonomics.
• Valdez, P., & Mehrabian, A. (1994). Effects of color on emotions. Journal of Experimental Psychology: General.
• Vinciūnas, M., & Kapočius, K. (2023). Dark vs. light mode task efficiency in e-commerce.
• Yoon & Zhu (2025/2026). Low color saturation and perceived luxury continuity heritage. Journal of Consumer Research.
Leave a Reply