


Unit economics is a component of break-even analysis that considers variable costs at the product or business unit level. It helps determine whether operational activities generating variable costs can also produce sufficient profit to cover fixed costs.
Variable Costs are expenses directly associated with selling a single unit of a company’s product or service. Examples include:
- Cost of Goods Sold (COGS).
- Packaging and shipping costs to customers.
- Return costs.
- Marketing and sales expenses.
- Customer support costs, especially if the number of inquiries increases with sales.
Fixed Costs are expenses that do not depend on production or sales volume. Examples include:
- Office expenses.
- Salaries of key employees and administrative staff.
- Certain technology expenses.
- Costs for intangible assets like patents and other intellectual property.
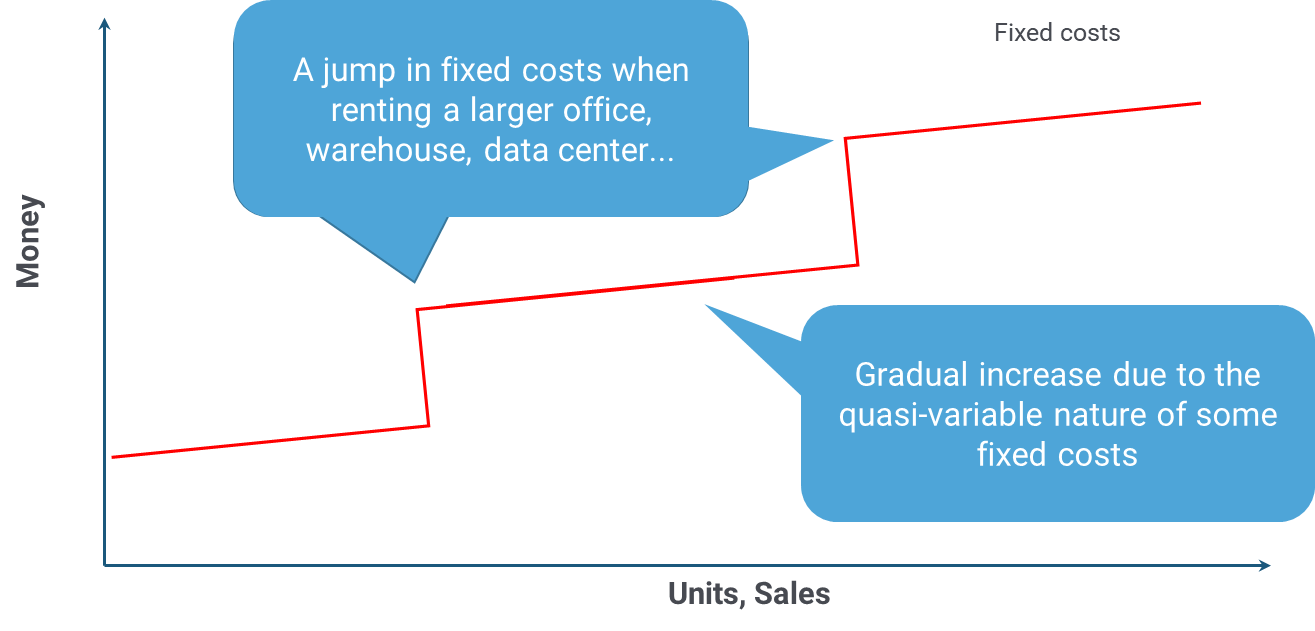
It’s important to note that the concept of fixed costs is somewhat relative. For example, if there is an increase in staff, a company might move to a larger office. Higher turnover could necessitate renting a new warehouse. Similarly, growing traffic and data volumes may cause an increase in IT expenses. These situations lead to cost increases associated with business growth, similar to variable costs.
In the long term, all costs are variable; they just change at different rates. For example, the size of the development team (a fixed cost) may grow slowly (quasi-variable costs).
In some situations, it can be challenging to determine whether costs are variable or fixed. For example, the aforementioned customer support costs. To reduce the risk of incorrect break-even analysis in such cases, include these costs in unit economics.
1. What is a Unit? #
There are two approaches to calculating unit economics, depending on the definition of a unit:
- Unit = Product
- If a unit is defined as a product, unit economics is calculated through the contribution margin of variable costs.
- Unit = Customer
- If a unit is defined as a customer, unit economics is calculated through Customer Acquisition Cost (CAC). It also uses Lifetime Value (LTV) over the entire period the product is used.
| What is a Unit? | |
| Unit = Product | Unit = Customer |
| Calculation through: CM (Contribution Margin) | Calculation through: CAC (Customer Acquisition Cost) and LTV (Lifetime Value) over the entire customer lifecycle |
2. Calculating Unit Economics via Contribution Margin #
If the sale of each unit (unit of product) creates a profit, it contributes a Contribution Margin. This margin helps cover the fixed costs. After a certain number of profitable units are sold, the Breakeven Point is reached.
If selling a unit does not generate profits to cover fixed costs, they cannot be covered by operating activities. Then it is worth considering whether it makes sense to scale an unprofitable product.
Graphically, this can be represented as follows:

Left Chart: Contribution Margin
- Represents revenue generated from sales.
- Shows the split between Variable Costs and Contribution Margin.
- Contribution Margin represents the portion of sales revenue that exceeds variable costs, contributing towards fixed costs and profit.
Right Chart: Breakeven Point
- Breakeven Point is the point where total revenue equals total costs, meaning no profit or loss.
- The chart highlights:
- Losses (below the breakeven point).
- Coverage Contribution (above variable costs but below the breakeven point).
- Profit (above the breakeven point).
- Fixed Costs are the costs that must be covered before reaching profitability.
As sales volumes increase, profit before fixed costs grows. “Contribution margin” on the graph intersects with the fixed costs line. The point where they intersect is the break-even point.
- Contribution Margin = Sales Revenue – Variable Costs
3. Calculating Unit Economics via Customer Acquisition Cost #
If a unit is defined as a customer, unit economics is typically calculated using two key metrics:
- Customer Acquisition Cost (CAC)
- Customer Lifetime Value (CLV or LTV)
Calculating these requires other metrics, such as:
| Metric | Value | How to measure? | |
| CPL | Cost per lead resulting from a customer acquisition campaign | $$$ | Cost of customer acquisition campaign / number of acquired leads |
| Conversion Rate | Leads to Customers: The ratio of leads to those who complete a desired action and ultimately become buyers | % | As a result of the campaign or for the period: number of acquired leads / number of acquired customers |
| CAC | Customer Acquisition Cost: The total cost of acquiring a customer | $$$ | Acquisition costs / number of new customers for the period |
| ARPA | Average Revenue per Account: The average revenue per customer in a period | $$$ | Revenue / number of new customers for the period |
| Churn Rate | Churn, Churn Rate: The proportion of revenue lost from existing customers who stop paying after a period | % | For the period |
| LTV | Customer Lifetime Value | $$$ | Revenue from the customer over the lifetime of the product: Forecast or fact |
| LTV / CAC | CAC Coverage Period | >3 = ok | Calculation based on forecast and/or actual numbers |
| CAC / ARPA | Customer Payback Period | Months | Calculation based on forecast or actual indicators |
| MNR | Monthly New Revenue: The monthly revenue from newly acquired customers | $$$/month | Monthly |
| MRR | Monthly Recurring Revenue: Monthly revenue from existing customers. | $$$/month | ARPA x number of paying customers |
Calculating unit economics through customer acquisition cost and customer lifetime value is typically applied in business models that use recurring subscriptions as a way to get paid (XaaS and others).
Example in Practice #
Consider a company selling physical goods online. If the price per unit is $100, and the COGS (which includes materials, labor, and shipping) is $40, then the contribution margin would start at $60.
However, the company still needs to consider other variable costs such as marketing expenses or distribution. The contribution margin directly affects how much can be invested back into acquiring new customers or growing the business.
COGS (Cost of Goods Sold) #
COGS is a fundamental component of Unit Economics and plays a crucial role in determining the profitability of a business.
COGS represents the direct costs associated with producing a product or delivering a service. These costs are primarily those directly tied to the production of each unit. That means they vary with the level of production or sales. COGS typically includes expenses such as raw materials, direct labor, and any other manufacturing or operational costs. They are necessary to produce or fulfill a product.
In practical terms, if a company produces a physical product, COGS will include the cost of acquiring materials, the labor required to assemble or manufacture the item, and any costs directly associated with making the product ready for sale. Unlike some other expenses, COGS only covers those costs that are directly related to production. It is a key metric for understanding the true cost of generating revenue from each product.
Unlike traditional physical products, a digital product may not have costs associated with raw materials or physical labor. However, COGS for such a product often includes scalable and recurring costs tied to digital resources usage like API calls, cloud resources etc. that grow as user demand increases.
For example, COGS for a digital product leveraging an AI API consists of the following components:
Component Description API Costs Usage fees paid to the AI service provider (e.g., OpenAI). These fees are typically based on the number of requests or tokens consumed by the application. Cloud Hosting Costs Costs associated with cloud infrastructure to run the application, including servers, databases, and storage resources. Data Processing Costs Costs related to storing and processing user data, including maintaining databases and retrieval systems for efficient user interactions. Integration & Deployment Costs Costs of integrating the API and deploying the product, including serverless functions, CDN charges, or automated scaling setups. Direct Software Licensing Fees Any licenses or third-party software needed for processing, integrating, or supporting the functionality of the product.
COGS differs from other variable costs that are incurred by businesses. While COGS refers strictly to the direct expenses linked to producing the product or delivering a service, other variable costs can include marketing, shipping, or sales commissions, which may fluctuate depending on the number of units sold but are not directly tied to the production process itself. For instance, a business may have advertising expenses that increase as more products are sold, but these expenses are not considered part of COGS because they do not impact the actual creation of the product.
The Contribution Margin is derived by subtracting COGS and other variable costs from the total revenue generated by a product. It measures how much money is left over after covering the production costs, which can then be used to pay for other operational expenses, such as marketing, salaries, and overhead. The formula for the Contribution Margin is as follows:
Contribution Margin = Revenue per Unit − COGS per Unit − Other Variable Costs per Unit
If COGS is high relative to the revenue generated, it reduces the contribution margin and, ultimately, profitability. In such cases, a business needs to explore ways to reduce production costs or increase pricing to maintain a healthy profit margin.
Another essential application of COGS in unit economics is in Breakeven Analysis. This analysis helps a business determine how many units it must sell to cover all its fixed and variable costs. Since COGS is a major component of variable costs, reducing COGS can lower the breakeven point, allowing the business to achieve profitability sooner with fewer units sold.
In assessing Customer-Level Profitability, COGS also plays an important role, particularly when evaluating Customer Acquisition Cost (CAC) versus Lifetime Value (LTV).
The LTV metric represents the total revenue expected from a customer over their lifetime of interactions with the business. By factoring in COGS, a company can more accurately calculate how profitable each customer relationship is, taking into account the costs of fulfilling their orders. High COGS can significantly diminish customer profitability unless balanced by strong customer retention, high per-customer revenue, or efficiencies in other areas.
How to Calculate Customer Acquisition Cost (CAC)? #
Customer acquisition cost over a period (e.g., month, quarter, year) is usually calculated with the following formula:

How to Calculate LTV? #
Calculating LTV (Lifetime Value) can be more complex, especially in the early stages of a product’s life when there is limited empirical data on how long customers will stay with your product and sales data over an extended period is not yet available. As a result, LTV is often calculated using forecasting methods that consider both churn (customers who stop paying) and expansion (growth in average revenue when existing customers pay more).
One simple way to forecast average LTV is to use projected average gross profit and average churn rate.
Gross Profit = Revenue from sales – Cost of Goods Sold (COGS)
LTV = Gross Profit / Churn
At the customer level, you can also use the following approach:

This formula can be used during the early stages of a product’s life, and it is often sufficient for initial projections. One challenge is estimating the churn rate, as there is no empirical data for cohorts at the beginning of a product’s life (discussed below). Therefore, benchmarks from similar business models should be used, and it’s best to plan for worst-case scenarios while hoping for the best.
| Pros | Cons |
|---|---|
| A simple formula | Does not work if you have very long customer lifetimes and negative churn due to customer expansion (adding more users) and/or ARPA growth |
| Easy to use in the business model at early stage | Does not consider the time value of money |
This formula also stops being useful in later stages, for example, when:
- The business enters a growth stage and establishes a sales process that attracts new customers and increases the average transaction size for existing customers.
- There is an understanding that customers have a long (but not infinite) lifecycle.
- There is negative churn (also called expansion), meaning that the remaining customers increase their average spending, paying more than the business loses from churn.
With negative churn, LTV becomes infinite in the above formula, rendering it meaningless. In this scenario, LTV calculation should consider expansion, the risks associated with revenue expected far into the future, and the time value of money.
Key metrics to calculate LTV for a product in the growth stage:
| Metric | Description |
|---|---|
| Average Revenue Per Account (ARPA) | The average revenue per customer over a given period. |
| Gross Profit and Gross Margin | Accounting for product costs, customer acquisition costs, upselling to existing customers, and customer support. |
| Churn Rate | The percentage of lost revenue from existing customers who stop paying after a given period. |
| Expansion Growth Rate for Retained Customers | The increase in average spending per customer over a given period. |
| Discount Rate | Used to account for the time value of money. |
Traditional Churn and LTV #
To analyze churn, you need to look at groups of customers who signed up during a specific period (usually a month). These groups are called cohorts. For example, the “January 2022 Cohort” includes all customers who signed up in January 2022. You then need to track how many customers continue to use the product in subsequent periods and how revenue changes for each cohort over time.
The following chart shows what happens to the share of paying customers in an initial cohort over 24 periods at three different annual churn rates:

When forecasting future revenue from a cohort, it is also advisable to discount cash flows to better account for the risk of missing forecasted revenues and to incorporate the time value of money.
As a result, cohort revenue decreases with churn and rises with higher discount rates.

Difference Between Customer Churn and Cash Churn #
It is important to remember that customer churn is not the same as cash churn. Losing a customer who pays less than the average versus losing a customer who pays more will result in similar churn rates in customer count but different impacts on revenue and cash churn.
Additionally, if retained customers increase their average spending, the absolute value of churn can become negative, as illustrated below.[1]

A negative cash churn or expansion occurs when the increase in the average spending (ARPA) of the remaining customers is higher than the level of customer churn.
To evaluate customer and revenue churn, you can use:
- Customer Retention Rate (CRR): CRR = 1 – Customer Churn Rate
- Financial Retention Rate (FRR): FRR = 1 — Cash Churn Rate
Thus, a business with negative churn will have a cash retention rate exceeding 100%.
The Financial Retention Rate (FRR, or DRR, Dollar Retention Rate) is one of the key metrics for evaluating the performance of cloud (XaaS) companies and subscription-based business models.
The impact of discounting future cohort cash flows with negative churn (expansion) is illustrated in the following example:
- Annual customer churn rate = 15%
- Annual growth rate for retained customers = 25%
- Financial retention rate (FRR) = 106.25%

As noted above, negative churn makes the simple LTV calculation ineffective. To account for possible expansion, you can use the adapted formula (David Skok’s formula):

LTV Calculation with DCF Applied to a Negative Churn Scenario (David Skok’s formula)
With the following values:
- Average Revenue Per Account × Gross Margin % (ARPA × Gross Margin %) = $1,000.
- Customer Churn Rate = 15%
- Growth rate for retained customers (G) = 25.00%
- FRR (or DRR) = 106.25%
… you will get the following LTV values at different discount rates:
| Discount Rate | 0% | 10% | 15% | 20% | 25% |
|---|---|---|---|---|---|
| K | 0.85 | 0.77 | 0.72 | 0.68 | 0.64 |
| LTV | $16,111 | $7,718 | $5,949 | $4,785 | $3,971 |

The discount rate used in the calculation should correspond to your company’s Weighted Average Cost of Capital (WACC). If you’re unsure of its value, consult your finance or investment analysts.
This formula approximates LTV more realistically but still does not account for some important aspects:
- Churn and expansion are not linear and depend on the length of contracts.
- Gross margin is not constant.
- Payment terms can vary significantly, cash flows differ from recognized revenue, and accounts receivable affect the cost of money and can be challenging to incorporate in this calculation.
- Forecasts always differ from actuals, so update calculations as actual data becomes available.
LTV to CAC Ratio #
A common best practice is:
- LTV should be at least three times higher than CAC: LTV > 3 × CAC
- Revenue should exceed CAC within 12 months or sooner: CAC < 12 × MRR
Note that these are general recommendations. The precise metrics depend on the specific business model, taking into account variable costs, average revenue, cost of capital, etc.
NBM4 Slide Deck #
Check it out in NBM4 slide deck at page 204.
- Based on: Skok, David. “What’s Your TRUE Customer Lifetime Value (LTV)? – DCF Provides the Answer.” For Entrepreneurs, David Skok, https://www.forentrepreneurs.com/ltv/. ↩︎
Leave a Reply